Address
Hyderabad
Work Hours
Monday to Friday: 7AM - 7PM
Weekend: 10AM - 5PM

 ByMudit Pincha
History:
This gap in financing was subsequently addressed by the emergence of private credit.
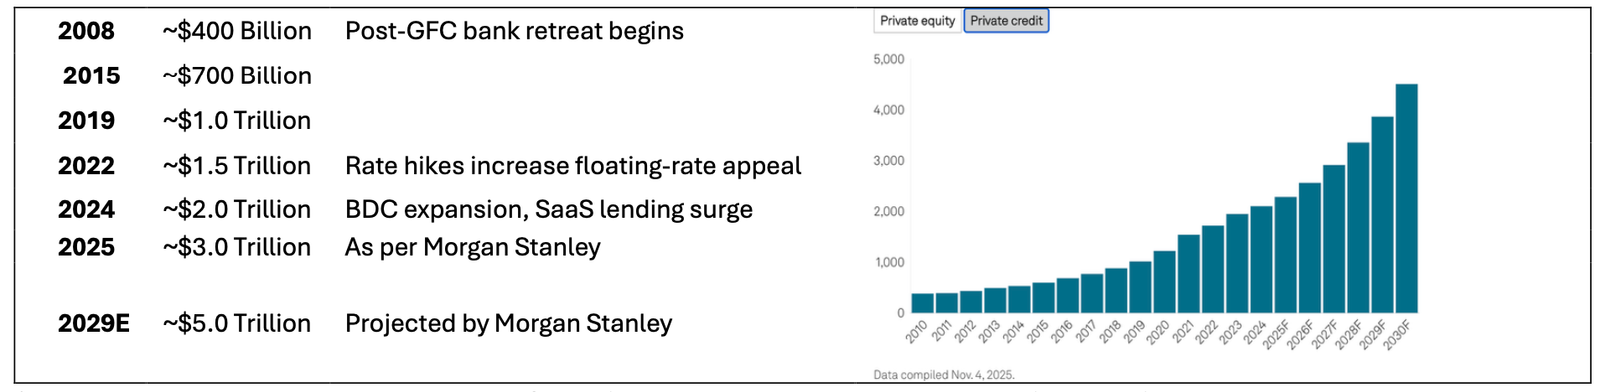
Structural drivers : PE-led deal flow, BDC scaling, and strong demand for floating-rate instruments, support the outlook for private credit AUM to reach ~$5 trillion by 2029 (~13-14% forward CAGR), as projected by Morgan Stanley.
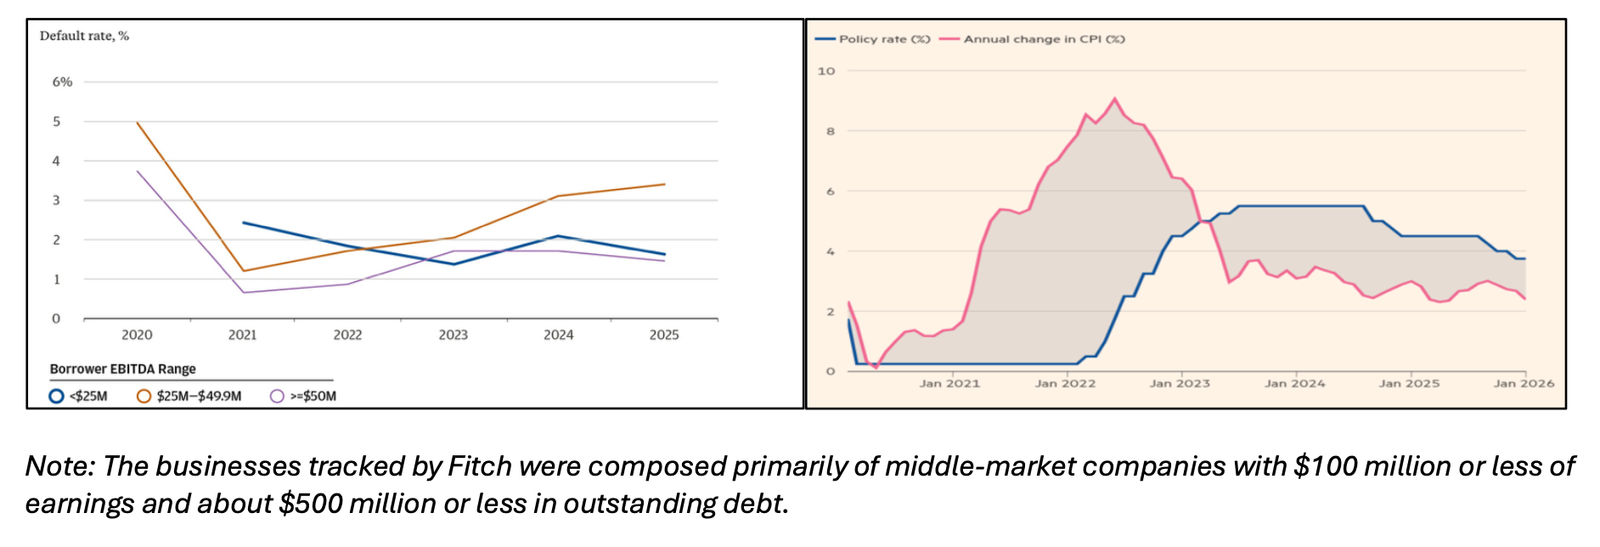
Turnaround : For much of the period following 2008, private credit experienced sustained growth and was widely regarded as a successful alternative to traditional bank lending. However, recent developments indicate emerging pressures that are beginning to challenge this trajectory.
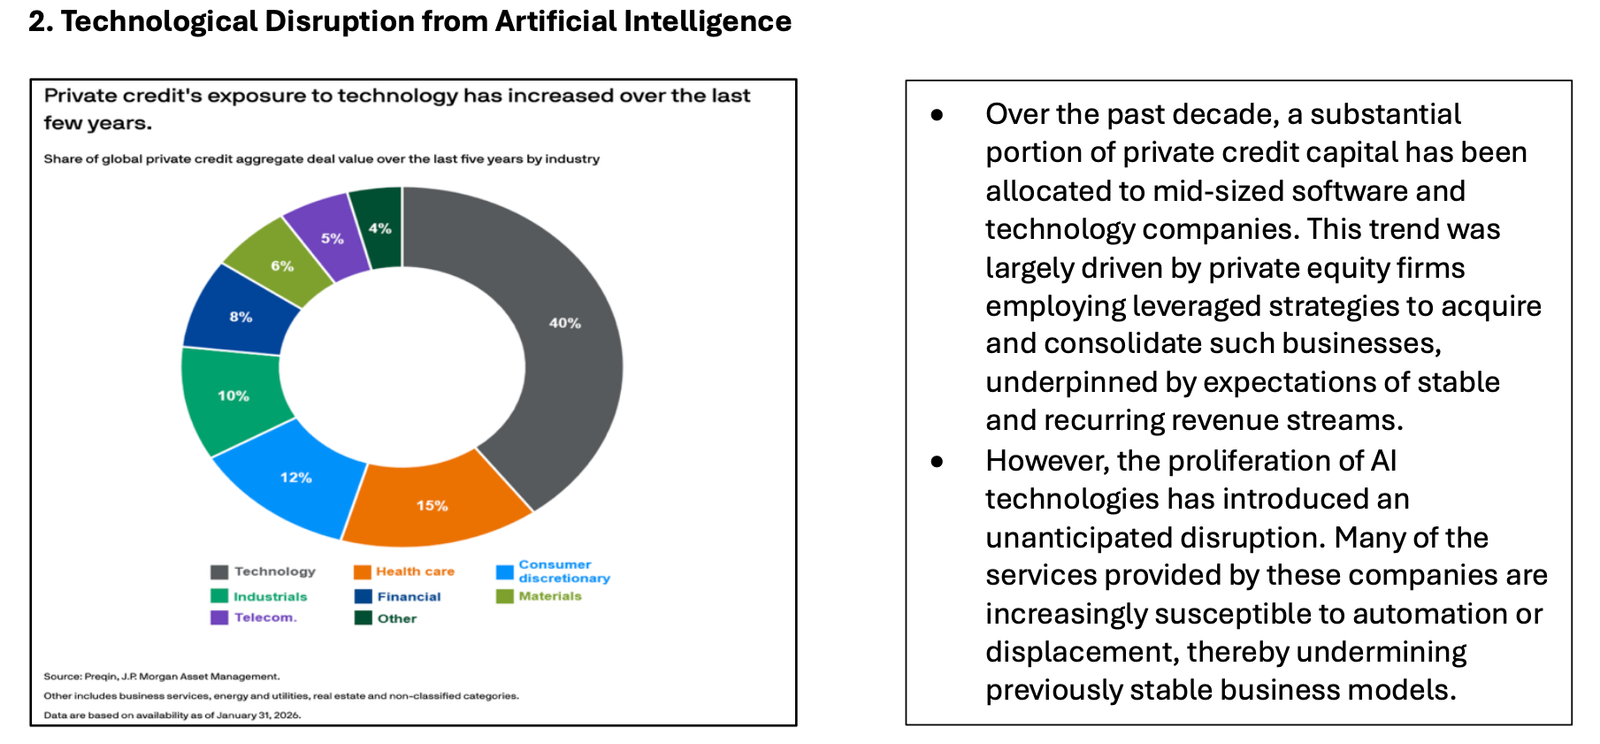
This technological disruption is particularly challenging for private credit due to the inherent asymmetry in its investment structure:
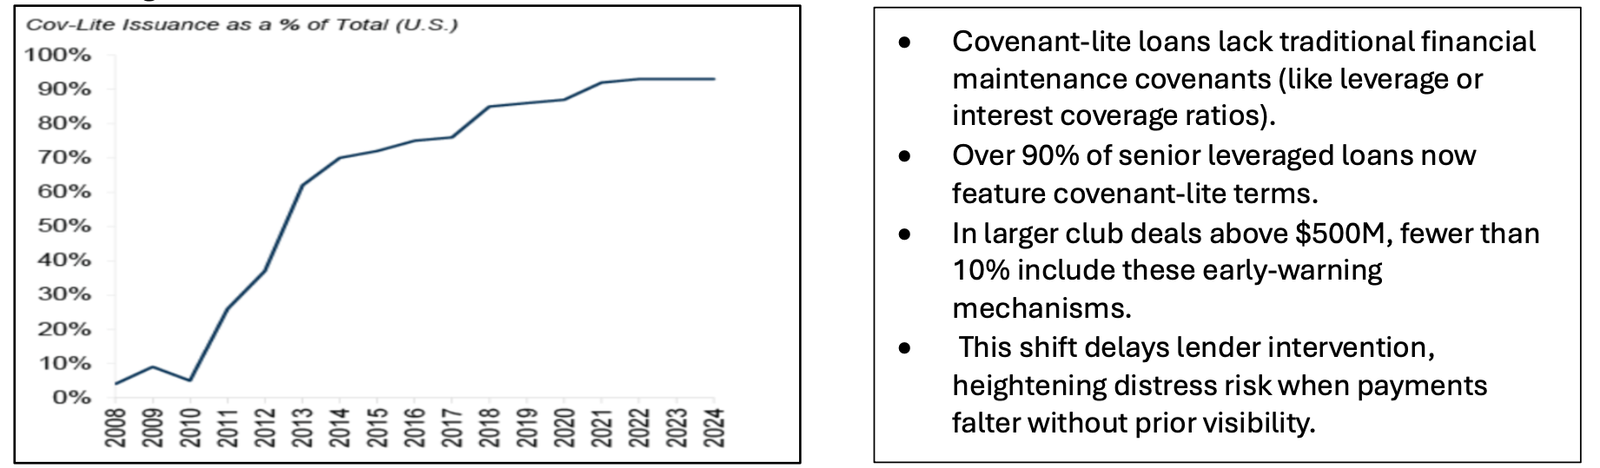
Structural Vulnerabilities : Beyond broader macroeconomic pressures, certain structural features of the private credit market are amplifying current stress conditions.
| Feature | Non-Traded BDC | Publicly Traded BDC |
| Investor type | Wealthy retail ($25K+ min) | Any public investor |
| Lock-up period | None (quarterly redemptions) | Daily liquidity |
| Redemption limit | Typically 5% per quarter | Open market |
| Price discovery | NAV (internal model) | Market price |
| Regulatory oversight | SEC (public registration) | SEC + exchange rules |
| Transparency | Quarterly filings | Daily/quarterly filings |
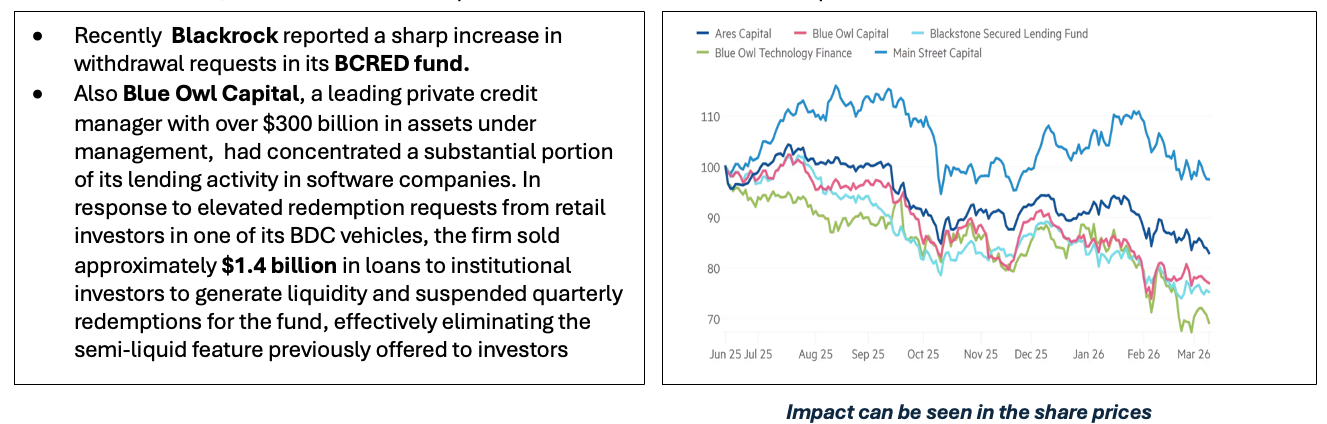
Non-traded BDCs promise semi-liquidity: investors can typically redeem up to 5% of fund NAV per quarter. This worked smoothly when markets were calm. When concern rose about software exposure and valuation opacity, retail investors rushed for the exits simultaneously.
If investors believe the actual value of the fund’s assets has fallen, but withdrawals are still allowed at higher stated values, they are incentivized to exit early. As redemption requests rise and exceed the 5% quarterly limit, funds suspend further withdrawals, which often increases panic and leads to more withdrawal pressure.
Outlook